CSP: Digital Information
Black and White Images
based on resources from code.org
PBL by Silver Oaks
Food for thought
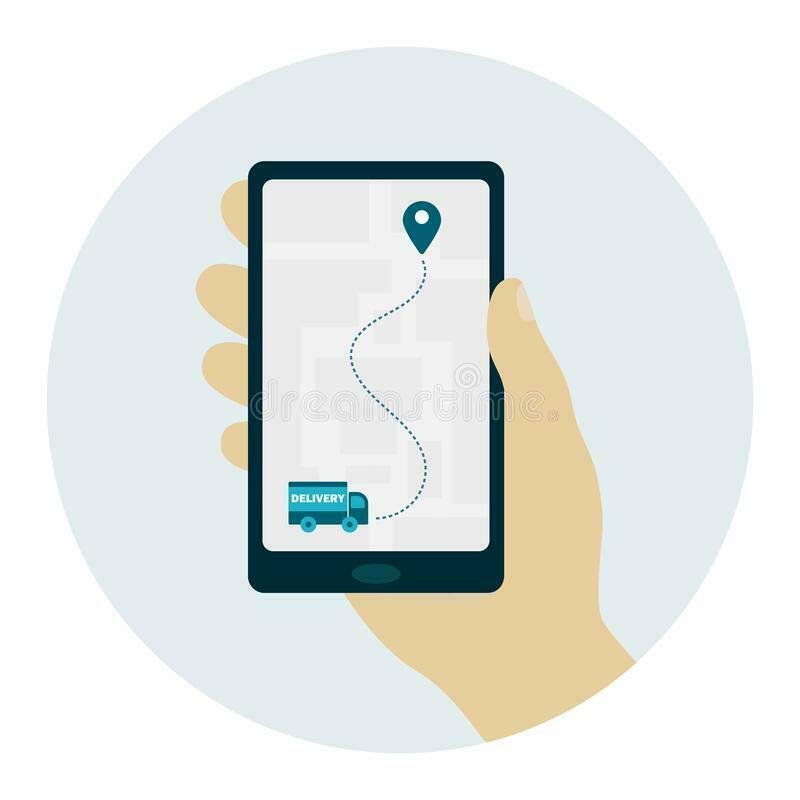
You recently did some online shopping and are expecting a package to arrive in about a month. The delivery service has a tracking system which reads the location of the package.
How often would you want the location read?
Every week? Every day? Every hour? Every minute?
Introduction
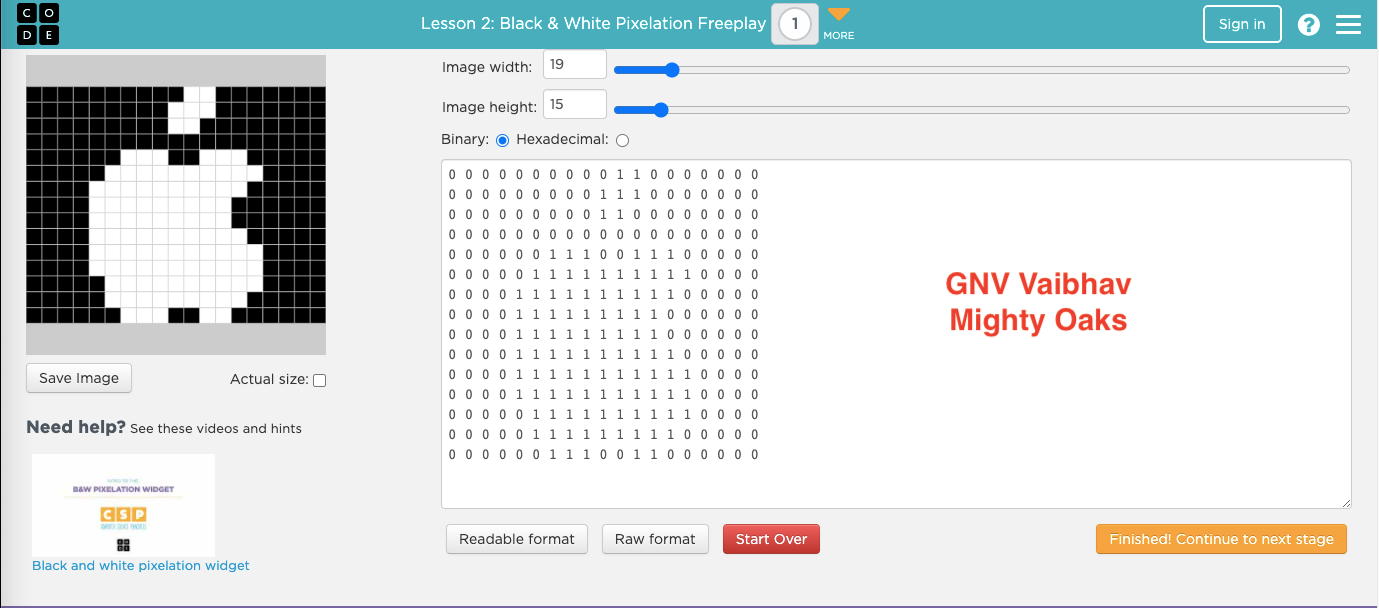
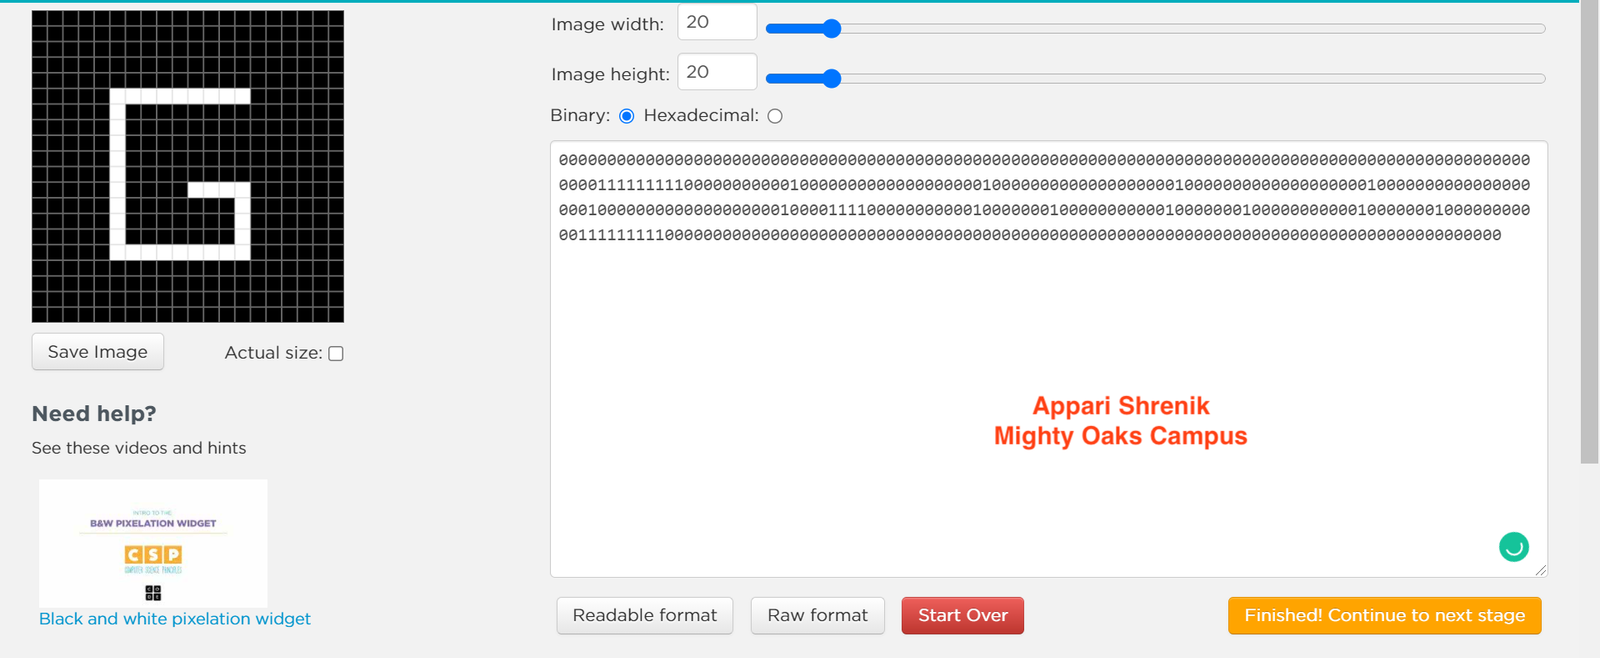
B&W Pixelation
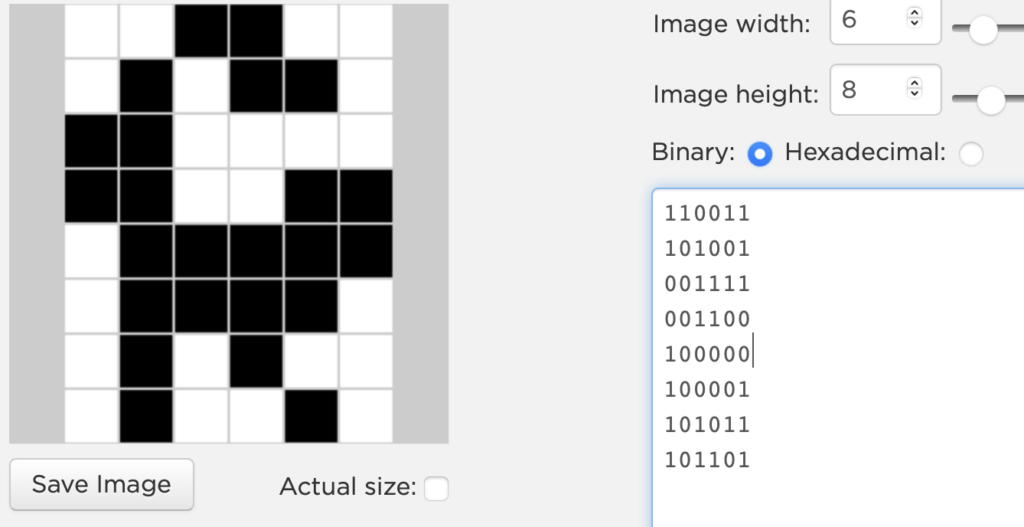
The video displays an old version of the Pixelation Widget. In the version you will use, you no longer need to set the width and height using binary numbers – you can use the slider at the top.
You may also note that the width and height is not displayed in your work space in binary numbers.
Note: While the video uses the word “metadata” to describe this information, you do not need to leave this lesson understanding metadata. Metadata will be covered in a later lesson.
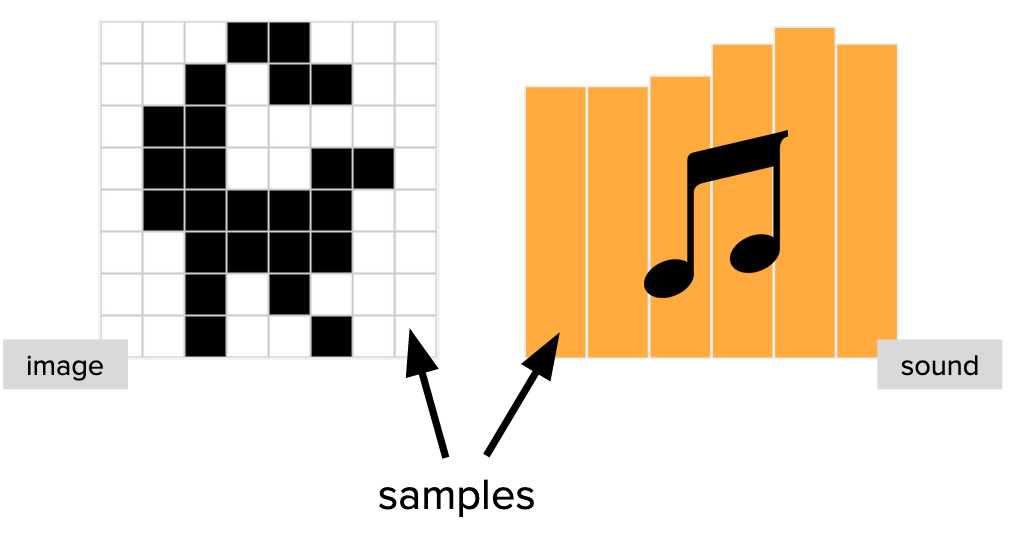
Now that you’ve had a chance to see how to set each pixel black or white, we are going to use the widget to represent an analog image using a process called sampling.
What is an analog? It’s a term used to mean something with continuous representation – such as a picture you draw on a piece of paper. Each pencil line smoothly connects to the next, no matter how much you zoomed in on the picture with a magnifying glass.
When we represent an analog image digitally, we will have to make some choices on how to sample the image to get the smoothest representation possible while keeping in mind the number of bits it takes to build that image.
What does it mean to sample? We are choosing how small to make section of the picture we look at when deciding whether to make it black or white. The smaller the sample, the more pixels required to represent that image. Larger samples require less pixels, but the image can become blurry.
Try it out yourself!
Activity
B&W Images
Work to digitally represent the image mentioned in the tasks below
- Read each square of the image and fill in the responses on the worksheet
- Enter the bits in Code Studio and use a timer to keep track of how long it takes
- Remember: Each bit can only be either black or white! You will have to decide for each square
Widget Task
- Make a 3 (width) X 5 (height) Image
- The widget is set to improper dimension make the necessary changes
- Start entering the pixel data to represent the letter ‘A’
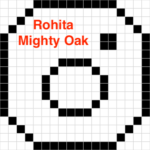
Draw / Plot (sample) the following image in the widget
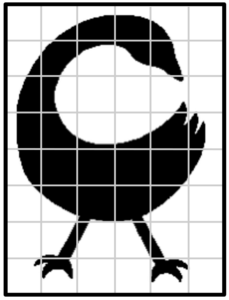
When finished sampling, reflect on the following:
- How many total bits were needed?
- How long did it take to build?
- How much does the digital image resemble this one? Why might that be the case?
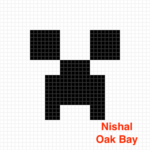
Draw / Plot (sample) the following image in the widget
This time, we will use sampling more frequently by reading the image using smaller squares.

-
How many total bits were needed?
-
How long did it take to build?
-
How does the new digital image compare to the one from Task 2? What effect did taking a larger number of samples have on the image?
- Select your favorite company logo.
- Decide how you are going to sample this logo – use one of the grids mentioned below. Draw the logo on a piece of paper first using one of the grids.
- Recreate the logo in the Pixelation Widget.
- Submit your drawing and the image produced in the pixelation widget in Google Classroom
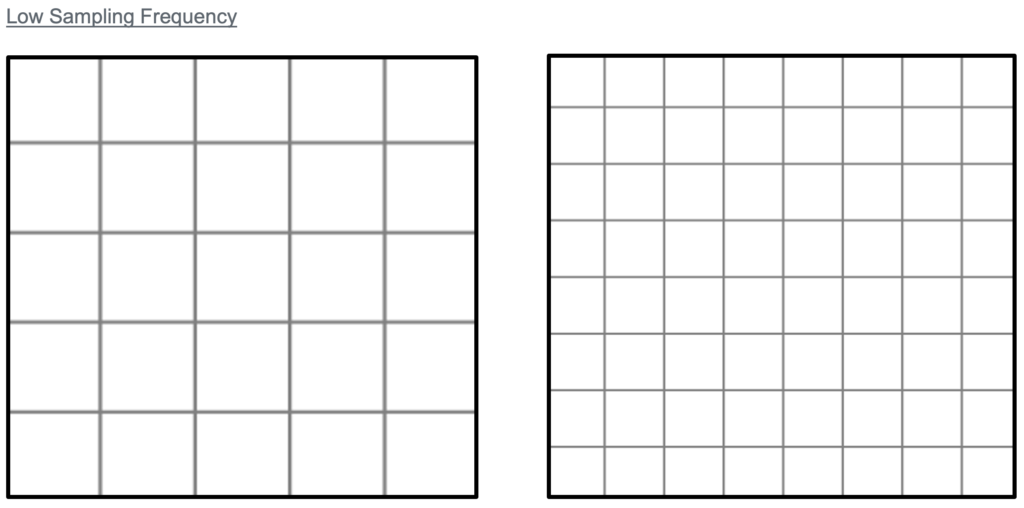 High Sampling Frequency
Answers
wrap up
Reflection
In Tasks 2 and 3, you practiced sampling the same image twice. The second time, we did a more frequent sampling by using smaller squares. In your journal make a note of
-
- What are the pros and cons of sampling an image more frequently?
Analog Data
Data with values that change continuously, or smoothly, over time. Some examples of analog data include music, colors of a painting, or position of a sprinter during a race.

Digital Data
Data that changes discreetly through a finite set of possible values

Sampling
A process for creating a digital representation of analog data by measuring the analog data at regular intervals called samples.
